Most advice about selling a house is written for a national market that does not exist. Here is what is actually happening in Columbus right now, what it costs to price wrong, and which improvements genuinely return their money in this region.
Selling on a deadline? Our Fort Benning real estate team plans the whole listing around your move date.
Where the Columbus market actually stands
Columbus, August 2026 (Redfin):
- Median sale price $249,735, up 1.9% year over year
- Median days on market 34 — 12 days longer than a year ago
- Sale-to-list ratio 97.4%
- 19% of homes sold above list, down from 21.6%
Read those together and the story is clear. Prices are holding. Speed is not. Taking nearly two extra weeks to sell, with fewer homes clearing list price, is a market handing leverage back to buyers without any dramatic price correction to announce it.
Across the river, Phenix City (June 2026) was moving faster — 21 days on market, 97.9% of list, 23.2% above list — though its median sale price was down 10% year over year. Different market, genuinely different dynamics.
What a slower market punishes
It punishes the list-high-and-see strategy, and the cost is measurable.
Zillow’s research on overpricing found homes that eventually sold 10% below their list price sat on the market five times longer than homes that sold at list. The pattern is steady: sell quickly and you land around 1% under list; sit for two months and it is more like 5% under; sit for eleven months and you are giving up around 12%.
Notice what that means. The discount is not the alternative to waiting. The discount is what waiting produces. A high list price does not protect your number — it delays the moment you find out what the number was.
Nationally this has become the norm rather than the exception. In February 2026, a record 34.2% of sellers cut their list price, and those who cut dropped an average of $40,915 — 7.3% off the original asking price.
Zillow is careful to call these correlations rather than proven cause and effect, and so are we. But the direction has been consistent for years, and we have never once seen a seller get the early-weeks attention back.
The first two weeks are the whole game
Every buyer with a saved search in your price band sees your house in its first few days. That is the largest and most motivated audience it will ever have. Price above them and they never click. By the time you correct, they have bought something else and the people still looking are watching your days-on-market count climb and reading it as a problem.
You get one first two weeks. There is no way to buy a second.
Where your price band sits
We could not find reliable days-on-market data broken out by price tier for Columbus specifically, and we would rather say so than make one up. What does exist is Georgia statewide supply by band (August 2026):
| Price band | Months of supply | Year over year |
|---|---|---|
| Under $200,000 | 4.6 | Tighter (−13.2%) |
| $200,000–$349,999 | 4.4 | +4.8% |
| $350,000–$499,999 | 4.8 | +4.3% |
| $500,000+ | 6.4 | +6.7% |
Statewide, the entry-level market is the tightest and the top end has the most slack. That pattern very likely holds here — Columbus’s median is under $250,000, so most of this market sits in the two fastest bands. If you are selling above $500,000, price and presentation matter more, not less.
The improvements that actually return
From the 2025 Cost vs. Value report for the South Atlantic region, which covers Georgia and Alabama. These are cost-recouped percentages at resale:
Worth doing:
- Garage door replacement — 227.7%
- Steel entry door replacement — 219%
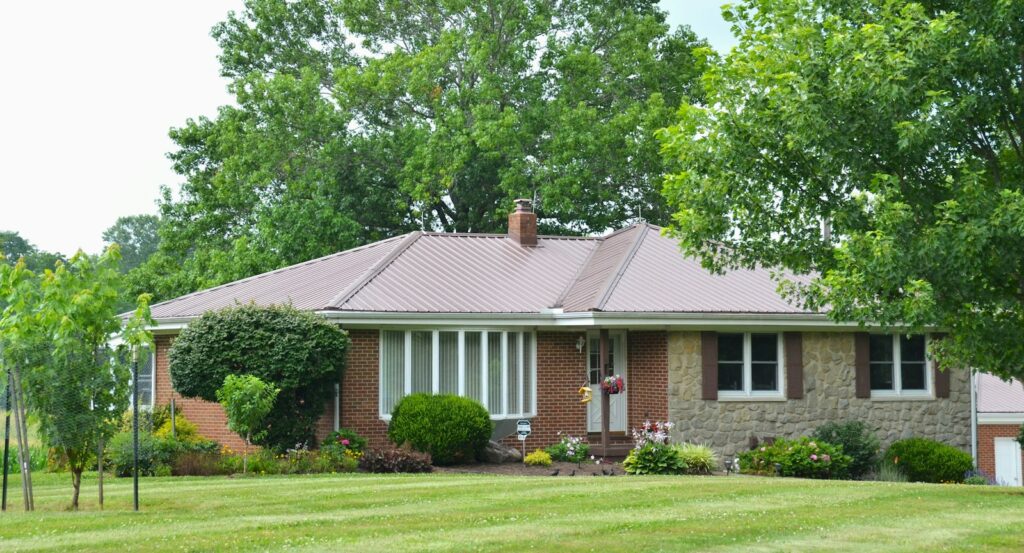
- Manufactured stone veneer — 197.2%
- Fiber-cement siding — 119.2%
- Minor kitchen refresh, midrange — 109.2%
Do it because you want it, not because it pays:
- Upscale primary suite addition — 18.8%
- Solar installation — 29%
- Upscale major kitchen remodel — 35.5%
- Upscale bathroom addition — 36.1%
- Backyard patio — 43.5%
The pattern is not subtle. The front of the house pays. The back of the house does not. Everything on the first list is something a buyer sees before they walk in — and everything on the second is something they will want to redo to their own taste anyway.
If your budget is a few thousand dollars rather than a few tens of thousands, that is good news. The highest-return work here is the cheapest work. Paint is what Realtors recommend more than anything else — half recommend painting the whole house before listing.
Staging: modest effect, real effect
From NAR’s 2025 staging research: 86% of buyers’ agents say staging affects how buyers see a home, 29% of agents reported it lifted offers by 1–10%, and 49% of listing agents saw it shorten time on market.
Worth keeping in proportion — about half of listing agents do not stage at all and instead push decluttering and repairs. For most houses in this market, that is the honest recommendation: clear it out, fix the obvious, and put the money into the front door rather than rented furniture.
When to list
Spring into early summer is the strongest window nationally, with the most buyers and the highest share of homes selling above list. December and January are the weakest, with the longest days on market and the highest likelihood of a price cut.
That said — a house priced correctly in November beats a house priced hopefully in May. Timing is the smaller lever.
What we would actually do
Want the real number for your address?
An automated estimate does not know that your neighbour’s comparable sale had a finished basement and yours does not. We will build you a pricing strategy on your actual house — what it should list at, what it will likely close at, and which of the improvements above are worth doing first.
Get your pricing strategy, or call or text (706) 525-5544.
Related reading
Before you rely on any of this
These are market conditions at a point in time, not a forecast and not a valuation of your house. This guide is here to show you what to weigh up when you price. Market figures are Redfin data for the months stated; cost-recouped percentages are the 2025 Cost vs. Value report for the South Atlantic region; staging figures are NAR, 2025. Regional averages will not match your street, your price band, or your condition. Ask us — or any agent you trust — for current numbers on your actual address before you decide anything.
Nothing here is financial or investment advice.